| SEQN | dsst_score | gender | age | marital_status | educ_level | income_ratio | alcohol_drinks_week | smoking | sleep_hours | healthy_diet | bmi | diabetes | coronary_dis | stroke | phq_9_score | rec_pa_minutes_week | hypertension_evidence |
|---|---|---|---|---|---|---|---|---|---|---|---|---|---|---|---|---|---|
| 73557 | 54 | Male | 69 | Separated | High school graduate/GED or equivalent | 0.86 | 0.0191791 | Not at all | 7 | Very good | 26.7 | Yes | No | Yes | 1 | 0 | Yes |
| 73559 | 63 | Male | 72 | Married | Some college or AA degree | 4.37 | 0.0000000 | Not at all | 8 | Good | 28.9 | Yes | No | No | 0 | 180 | Yes |
| 73561 | 59 | Female | 73 | Married | College graduate or above | 5.00 | 0.0000000 | NA | 9 | Very good | 19.7 | No | No | No | 9 | 0 | Yes |
| 73564 | 79 | Female | 61 | Widowed | College graduate or above | 4.18 | 0.0383583 | NA | 9 | Fair | 35.7 | No | No | No | 2 | 0 | Yes |
| 73567 | 30 | Male | 65 | Widowed | 9-11th grade (Includes 12th grade with no diploma) | 1.14 | 4.0000000 | Every day | 7 | Good | 22.0 | No | No | No | 3 | 0 | Yes |
nhanes-dsst-congition-analysis
Research Question and Introduction
Research Question
What factors are associated with cognitive functioning among adults aged 60 years and older in the United States?
Introduction
Cognitive functioning is a key component of healthy aging and is closely linked to independence, quality of life, and overall well-being among older adults. Declines in cognitive performance are associated with increased risk of disability, institutionalization, and mortality, making the identification of factors related to cognitive health a public health priority (Rivan et al. 2021).
Cognitive functioning in later life is influenced by a complex interplay of demographic, socioeconomic, behavioral, physical, and mental health factors. The goal of this analysis is to explore associations between cognitive performance and a broad set of variables among U.S. adults aged 60 years and older, using data from a nationally representative health survey. This report is exploratory and iterative in nature and will be updated as the project progresses.
Note
This is a preliminary and evolving analysis. The literature review is not intended to be exhaustive, and modeling decisions (including weighting and missing data handling) will be refined in future versions.
Data Source and Sample
Data Source
Data for this analysis come from the National Health and Nutrition Examination Survey (NHANES) 2013–2014 cycle, a cross-sectional survey designed to assess the health and nutritional status of the non-institutionalized U.S. population.
Study Sample
The analytic sample includes adults aged 60 years and older who participated in the cognitive function component of NHANES. The working dataset contains 1785 participants.
At this stage, analyses are conducted on the unweighted sample. Survey weights will be incorporated in later modeling stages to produce population-representative estimates and to appropriately account for the complex survey design.
Outcome: Cognitive Function
Digit Symbol Substitution Test
Cognitive functioning is assessed using the Digit Symbol Substitution Test (DSST), a widely used neuropsychological test administered in NHANES as part of the cognitive function examination for older adults (Jaeger 2018).
The DSST measures general cognitive performance, such as:
Processing speed
Sustained attention
Working memory
Participants are asked to match symbols to numbers according to a key within a fixed time limit. The final score reflects the number of correct matches, with higher scores indicating better cognitive performance.
In NHANES 2013–2014, DSST scores range from 0 to 133, with observed scores in this sample spanning a narrower range typical of older populations. The DSST is particularly sensitive to age-related cognitive changes and has been shown to predict functional decline and mortality in older adults (Rosano et al. 2008).
Data Merging
Data from multiple NHANES components were merged using the unique participant identifier (SEQN). Outcome: DSST (CFDDS in NHANES).
Variable Selection
| Predictor | Variable(s) in NHANES | Description |
|---|---|---|
| Age | RIDAGEYR |
Direct measure, continuous. |
| Gender | RIAGENDR |
Direct measure, categorical, nominal. |
| Marital status | DMDMARTL |
Comprehensive categorical measure, nominal. |
| Education level | DMDEDUC2 |
Highest Degree, categorical, ordinal. |
| Income-to-poverty ratio | INDFMMPI |
Monthly family poverty index, accounts for household size and income, continuous. |
| Alcohol drinks per week | ALQ120Q, ALQ120U |
Derived from total drinks/week-month-year in the past year, continuous. |
| Current smoking status | SMQ040 |
“Do you now smoke cigarettes”, categorical, ordinal (“Not at all”, “Some days”, “Every day”). |
| Diet quality | DBQ700 |
“How healthy is your diet”, a self-rated measure ranging from poor to excellent. This variable was selected as a parsimonious indicator of overall dietary quality, avoiding the complexity of detailed nutrient intake variables. Categorical, ordinal. |
| Physical (recreational) activity, total minutes per week | PAQ650, PAQ655, PAD660, PAQ665, PAQ670, PAD675 |
Derived. Physical activity was operationalized using recreational moderate and vigorous activities. Recreational activity was preferred over work-related and transportation-related physical activity variables, as they are the most relevant indicator of intentional physical engagement. Continuous. |
| Sleep Duration | SLD010H |
How much sleep do you get (hours), continuous. |
| Body mass index | BMXBMI |
Body Mass Index, continuous. |
| Diabetes | DIQ010 |
“Doctor told you have diabetes”, a self-reported physician diagnosis. This measure was preferred over laboratory biomarkers to ensure consistency with other self-reported health conditions and to reflect clinically recognized disease status. Categorical, nominal. |
| Cardiovascular/Coronary heart disease | MCQ160C |
“Ever told you had coronary heart disease”, self-reported physician diagnosis used to identify history of coronary cardiovascular disease. Categorical, nominal. |
| Hypertension evidence | BPQ020, BPXSY*, BPXDI* |
Hypertension was expressed using a composite indicator (“hypertension_evidence”) combining self-reported prior diagnosis and measured blood pressure values collected during the examination. This approach aimed to capture both diagnosed hypertension and undiagnosed but currently elevated blood pressure. Categorical, nominal. |
| Stroke | MCQ160F |
“Ever told you had stroke”, self-reported physician diagnosis used to identify history of stroke. Categorical, nominal. |
| Depressive symptoms | DPQ010:DPQ090 |
PHQ-9 questions: nine-item depression screening instrument, determining the frequency of depression symptoms over the past 2 weeks. Continuous. |
These variable selections reflect a balance between conceptual relevance and interpretability. Given the exploratory nature of this analysis, parsimonious representations were prioritized over highly granular measures.
For chronic conditions such as diabetes, hypertension, cardiovascular disease, and stroke, indicators are based primarily on self-reported physician diagnoses and/or examination-based measures. Two limitations should be noted. First, undiagnosed disease may lead to misclassification, particularly for conditions that can remain asymptomatic. Second, effective treatment may result in individuals with diagnosed conditions exhibiting cognitive functioning comparable to those without the condition at the time of assessment. These factors may attenuate associations and should be considered when interpreting results.
Here are some examples of the merged data:
Overall, there are 1785 rows and 18 columns (including SEQN).
Missing data (NA) will be addressed in the subsequent section.
Missing Data
First, let’s take a look at how many missing values are per variable:
| SEQN | dsst_score | gender | age | marital_status | educ_level | income_ratio | alcohol_drinks_week | smoking | sleep_hours | healthy_diet | bmi | diabetes | coronary_dis | stroke | phq_9_score | rec_pa_minutes_week | hypertension_evidence | |
|---|---|---|---|---|---|---|---|---|---|---|---|---|---|---|---|---|---|---|
| Count | 0 | 193.0 | 0 | 0 | 2.0 | 3.0 | 201.0 | 410 | 895.0 | 5.0 | 1.0 | 36 | 1.0 | 12.0 | 4.0 | 143 | 0 | 26.0 |
| Percent | 0 | 10.8 | 0 | 0 | 0.1 | 0.2 | 11.3 | 23 | 50.1 | 0.3 | 0.1 | 2 | 0.1 | 0.7 | 0.2 | 8 | 0 | 1.5 |
In total, there are 1128 or around 63.19% incomplete rows.
Some variables include rare responses (e.g., “Refused” or “Don’t know”), which have been recoded as NA to simplify modeling and avoid inflating the number of levels with very few observations. This procedure slightly increased overall missingness for certain predictors. Notably:
Marital status: 100% of missing values (n = 2) correspond to “Refused” and “Don’t know” responses.
Education level: 100% of missing values (n = 3) correspond to “Don’t know.”
Sleep hours: 40% of missing values (n = 2) correspond to “Don’t know.”
Healthy diet: 100% of missing values (n = 1) correspond to “Don’t know.”
Diabetes: 100% of missing values (n = 1) correspond to “Don’t know.”
Coronary disease: 100% of missing values (n = 12) correspond to “Don’t know.”
Stroke: 100% of missing values (n = 4) correspond to “Don’t know.”
Several variables exhibit higher overall levels of missingness and warrant further investigation, including smoking status (50.10% missing), income-to-poverty ratio (11.30%), alcohol consumption (23.00%), PHQ-9 score (8.00% total missing; among these, 12.58% reflect partial questionnaire completion and were recoded as missing), and BMI (2.00%).
The outcome variable, DSST score, has approximately 10.80% missing values. Importantly, the NHANES survey provides explicit reasons for non-administration of the DSST (check CFDDPP, CFDDRNC, and CFASTAT variables in NHANES), allowing for a more informed assessment of outcome missingness.
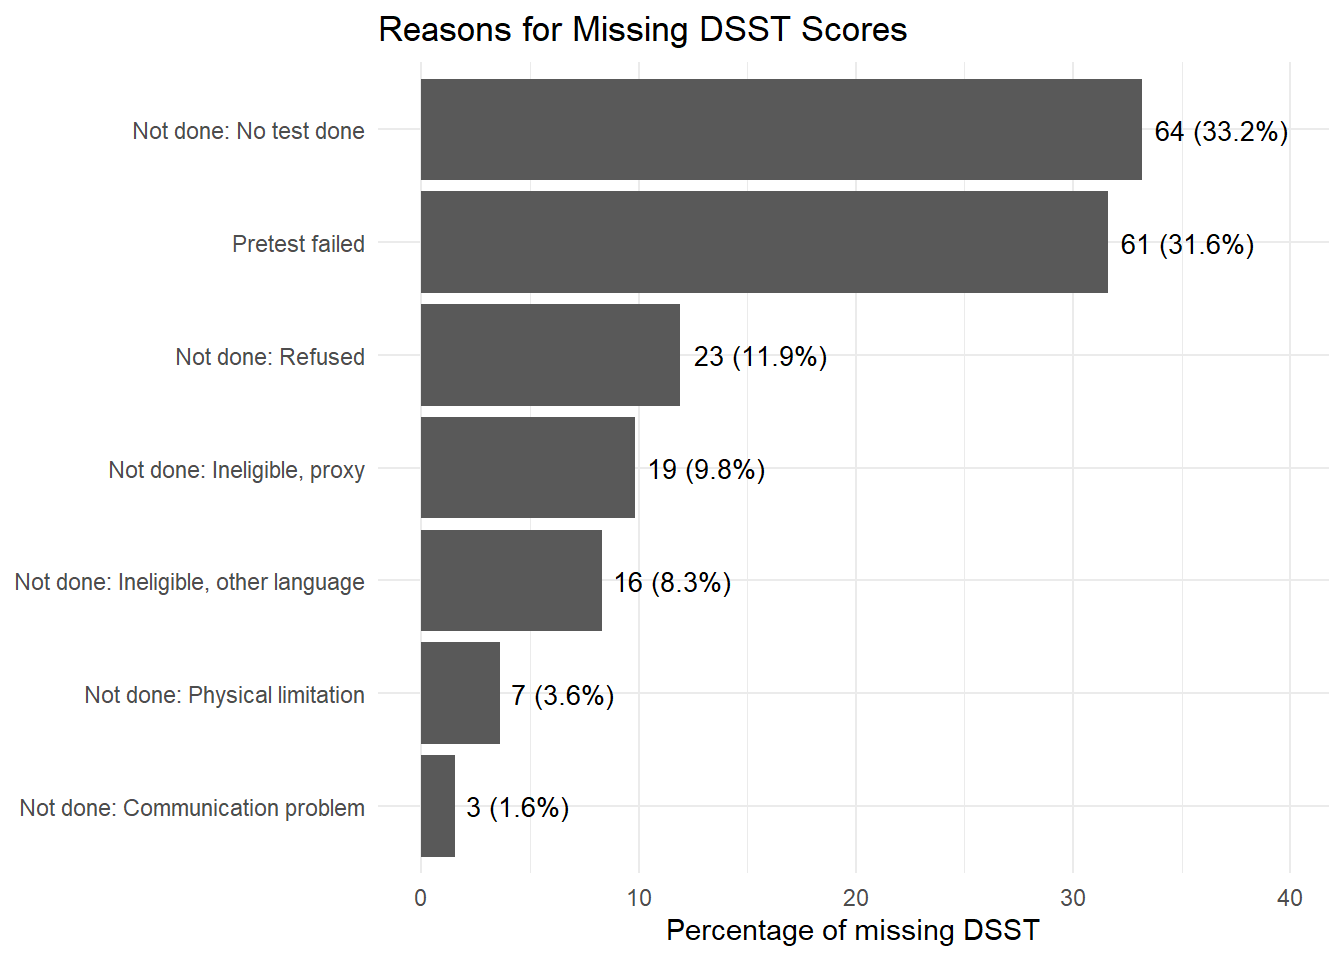
Figure 1 displays the distribution of reasons for missing DSST scores.
Exploratory Data Analysis (EDA)
Statistical Modeling
Limitations
Conclusion
References
Anstey, Kaarin J et al. 2009. “Alcohol Consumption as a Risk Factor for Dementia and Cognitive Decline: Meta-Analysis of Prospective Studies.” The American Journal of Geriatric Psychiatry 17 (7): 542–55.
Arikawa, Andrea Y et al. 2025. “Cognitive Impairment Is Associated with Alterations in Diet Quality and Inflammatory Biomarkers in Older Adults: A Cross-Sectional Analysis of Data Collected from the Microbiome in Aging Gut and Brain (MiaGB) Consortium Cohort.” The Journal of Nutrition.
Biessels, G. J. et al. 2006. “Risk of Dementia in Diabetes Mellitus: A Systematic Review.” The Lancet Neurology 5 (1): 64–74.
Erickson, Kirk I. et al. 2011. “Exercise Training Increases Size of Hippocampus and Improves Memory.” Proceedings of the National Academy of Sciences 108 (7): 3017–22.
Fitzpatrick, A. L. et al. 2009. “Midlife and Late-Life Obesity and the Risk of Dementia: Cardiovascular Health Study.” Archives of Neurology 66 (3): 336–42.
Fratiglioni, Laura et al. 2004. “An Active and Socially Integrated Lifestyle in Late Life Might Protect Against Dementia.” The Lancet Neurology 3 (6): 343–53.
Ganguli, Mary et al. 2006. “Depressive Symptoms and Cognitive Decline in Late Life: A Prospective Epidemiological Study.” Archives of General Psychiatry 63 (2): 153–60.
Gorelick, P. B. et al. 2011. “Vascular Contributions to Cognitive Impairment and Dementia: A Statement for Healthcare Professionals from the American Heart Association/American Stroke Association.” Stroke 42 (9): 2672–2713.
Iadecola, Costantino et al. 2016. “Impact of Hypertension on Cognitive Function: A Scientific Statement from the American Heart Association.” Hypertension 68 (6): e67–94.
Jaeger, Judith. 2018. “Digit Symbol Substitution Test: The Case for Sensitivity over Specificity in Neuropsychological Testing.” Journal of Clinical Psychopharmacology 38 (5): 513–19.
Jefferson, Angela L et al. 2011. “A Life Course Model of Cognitive Activities, Socioeconomic Status, Education, Reading Ability, and Cognition.” Journal of the American Geriatrics Society 59 (8): 1403–11.
McCarrey, A. C. et al. 2016. “Sex Differences in Cognitive Trajectories in Clinically Normal Older Adults.” Psychology and Aging 31 (2): 166–75.
Pendlebury, S. T. et al. 2009. “Prevalence, Incidence, and Factors Associated with Pre-Stroke and Post-Stroke Dementia: A Systematic Review and Meta-Analysis.” The Lancet Neurology 8 (11): 1006–18.
Peters, Ruth et al. 2008. “Smoking, Dementia and Cognitive Decline in the Elderly, a Systematic Review.” BMC Geriatrics 8 (1): 36.
Rivan, Nurul Fatin Malek et al. 2021. “Cognitive Frailty Is a Robust Predictor of Falls, Injuries, and Disability Among Community-Dwelling Older Adults.” BMC Geriatrics 21 (1): 593.
Rosano, Caterina et al. 2008. “Association Between Lower Digit Symbol Substitution Test Score and Slower Gait and Greater Risk of Mortality and of Developing Incident Disability in Well-Functioning Older Adults.” Journal of the American Geriatrics Society 56 (9): 1618–25.
Salthouse, Timothy A. 2010. “Selective Review of Cognitive Aging.” Journal of the International Neuropsychological Society 16 (5): 754–60.
Stern, Yaakov. 2012. “Cognitive Reserve in Ageing and Alzheimer’s Disease.” The Lancet Neurology 11 (11): 1006–12.
Yaffe, Kristine et al. 2014. “Connections Between Sleep and Cognition in Older Adults.” The Lancet Neurology 13 (10): 1017–28.